local · localhost:8999

Stop asking the agent
how it thinks it’s doing.
Signal House is a local operator dashboard for AI-assisted development. It reads Git, GitHub and agent sessions, then shows the boring evidence that actually matters: delivery, cycle time, CI health and spend.
LOCAL STATEFAIL CLOSEDNO CLOUDNO TELEMETRYNO SYNTHETIC ZEROSONE BUN PROCESSREAL DELIVERY DATA
01 WHY IT EXISTS
Busy is not the same
as shipping.
Agent tooling is excellent at producing activity. Sessions run. Tokens disappear. Terminals scroll. None of that tells you whether useful work is getting merged.
Signal House ignores the self-report and reads the systems of record instead. Git tells it what changed. GitHub tells it what shipped. CI tells it what broke. Agent databases tell it what the work cost.
signalsourceoperator questioncontract
throughput
git + githubDid work actually land?observedcycle time
issues + PRsHow long does delivery take?measuredCI health
actions + checksAre changes staying healthy?ground truthagent spend
session DBsWhat did that output cost?direct / estimatedmissing data
any sourceDo we actually know?— unknownRead the ground truth.
Keep it local.
The collector layer reads local repositories, GitHub and supported agent databases. A small orchestration layer refreshes and normalises that data into SQLite. The React dashboard reads one privacy-filtered API surface.
COLLECT
collect → normalise → filterLOCAL API
local onlyReact + EChartsBuilt for operators,
not dashboard theatre.
The product is intentionally opinionated about data quality and privacy. A prettier number is never more valuable than an honest one.
RULE_01
—
Unknown stays unknown.
Missing data is rendered as an em dash instead of silently becoming zero. No synthetic zero-days. No confident fiction.
RULE_02
Privacy fails closed.
If repository visibility cannot be verified, Signal House treats it as private. Private-repo attention items remain hidden unless explicitly enabled.
RULE_03
Local means local.
No hosted analytics service, account or telemetry pipeline. One process reads the state already on your machine and serves the operator UI.
02 OPERATOR SURFACE
Five numbers.
Drill down when needed.
The top-level view is deliberately compact: throughput, cycle time, CI pass rate, stale work and agent spend. The rest of the interface exists to answer “why?” when one of those moves.
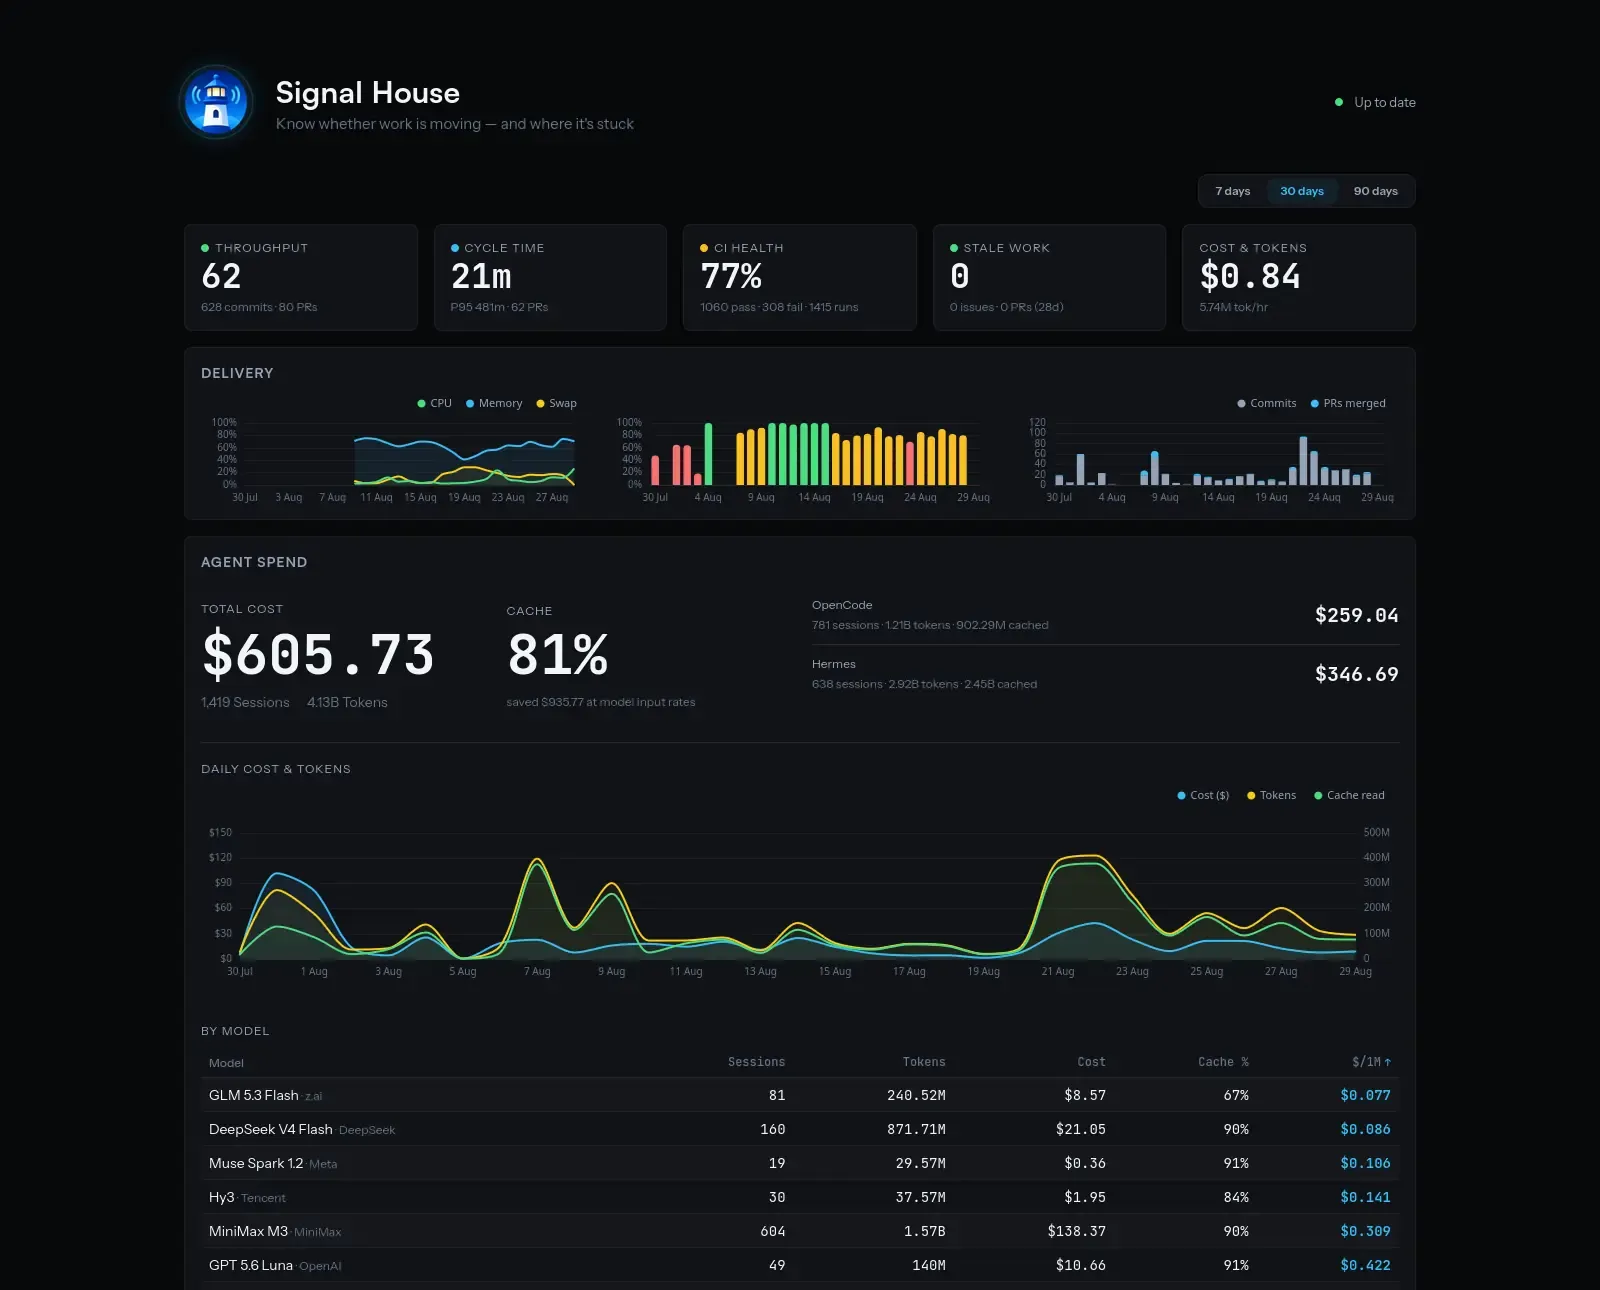
Delivery
Commits, merged PRs and CI pass rate share the same 7/30/90-day window so activity and quality can be read together.
Agent spend
Cost, sessions, tokens, cache hit rate and per-model efficiency expose where the budget is actually going.
Attention queue
Open issues and PRs that need eyes surface with age, staleness and CI state attached.
Diagnostics
Collector health, discovered repositories and configuration state stay inspectable instead of failing invisibly.
One runtime.
Very little ceremony.
Signal House was rewritten around Bun to keep deployment boring: one runtime, one package manager and one server process.
~/signal-housebash
$
git clone git@github.com:barkley-assistant/signal-house.git$
cd signal-house && bun install$
cp .env.example .env$
bun run devoperator dashboard listening
http://localhost:3000Bun 1.4TypeScriptReact 19SQLiteEChartsZustandPlaywrightsystemd
// case studyThe thinking
The thinking
behind Signal House.
Why it exists
Agent tooling makes it very easy to feel productive. Sessions run, tokens disappear and terminals scroll, but none of that tells you whether anything useful actually got merged or what it cost. I wanted numbers I could trust more than an agent's opinion of its own work.
Decisions and tradeoffs
- 01Read systems of record
Git, GitHub, CI and the agent session databases are the sources. Nothing on the dashboard comes from an agent describing what it thinks it did.
- 02Unknown is not zero
Missing data renders as an em dash. A chart full of synthetic zeros looks tidier, but it's lying to you.
- 03Privacy fails closed
If a repository's visibility can't be verified, it's treated as private. No hosted analytics, accounts or telemetry.
- 04One runtime
The rewrite around Bun means one runtime, one package manager and one server process, which keeps running it locally boring in the good way.
OPERATOR CONSOLE READY
See whether the work
is actually moving.
Run it locally, inspect the source, or open the live deployment.